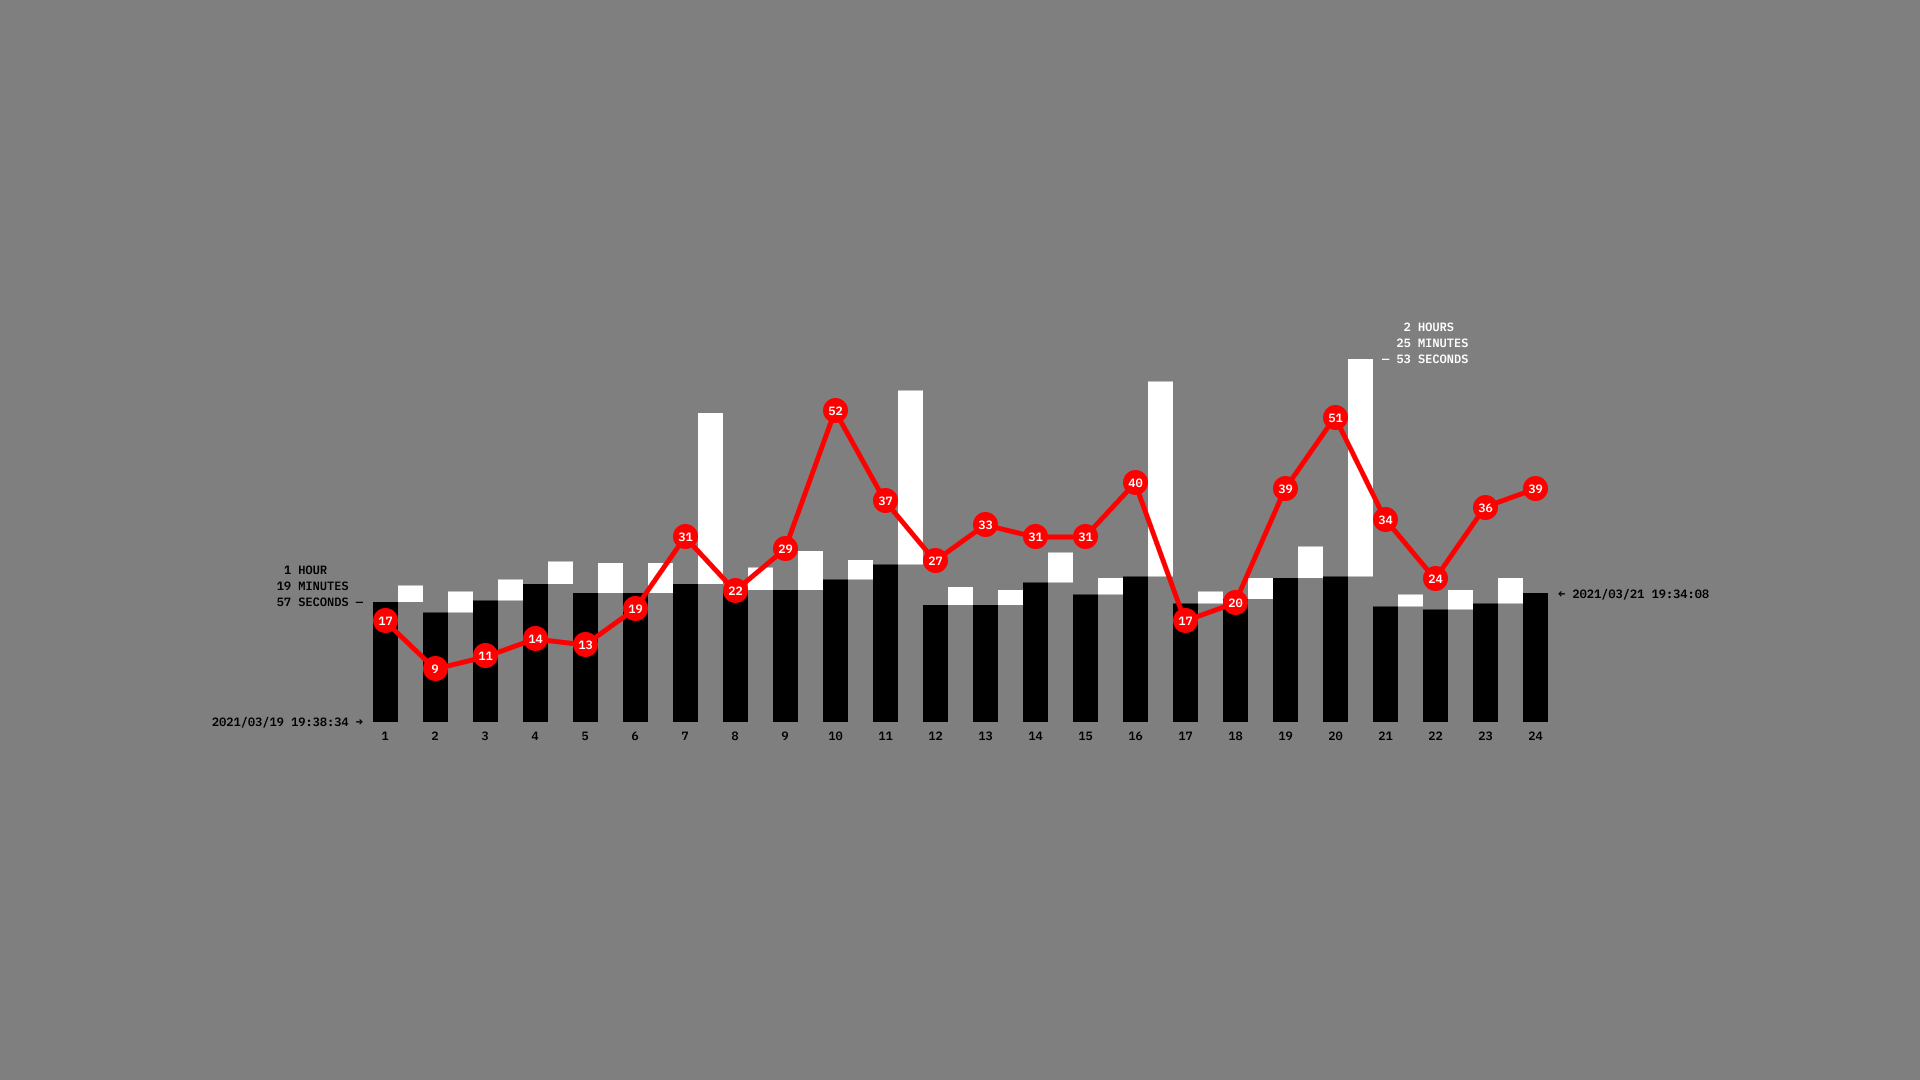
↑ The black bars represent the time taken to complete each sheet of paper, while the white bars indicate the time between sheets. The red dots mark the instances when I had to stop because I lost my attention.
This image reveals a pattern: the number of times I had to stop decreases after the long breaks I took for sleep (7-8, 11-12, 16-17, and 20-21).
The graph generated by the red dots remains fairly consistent, except for sheets 1 and 10, when Poncho was documenting the performance, making it harder for me to stay focused. He was also present at the end of sheet 24, but no noticeable disruption appears in the graph. For the rest of the performance, I remained alone to minimize distractions.