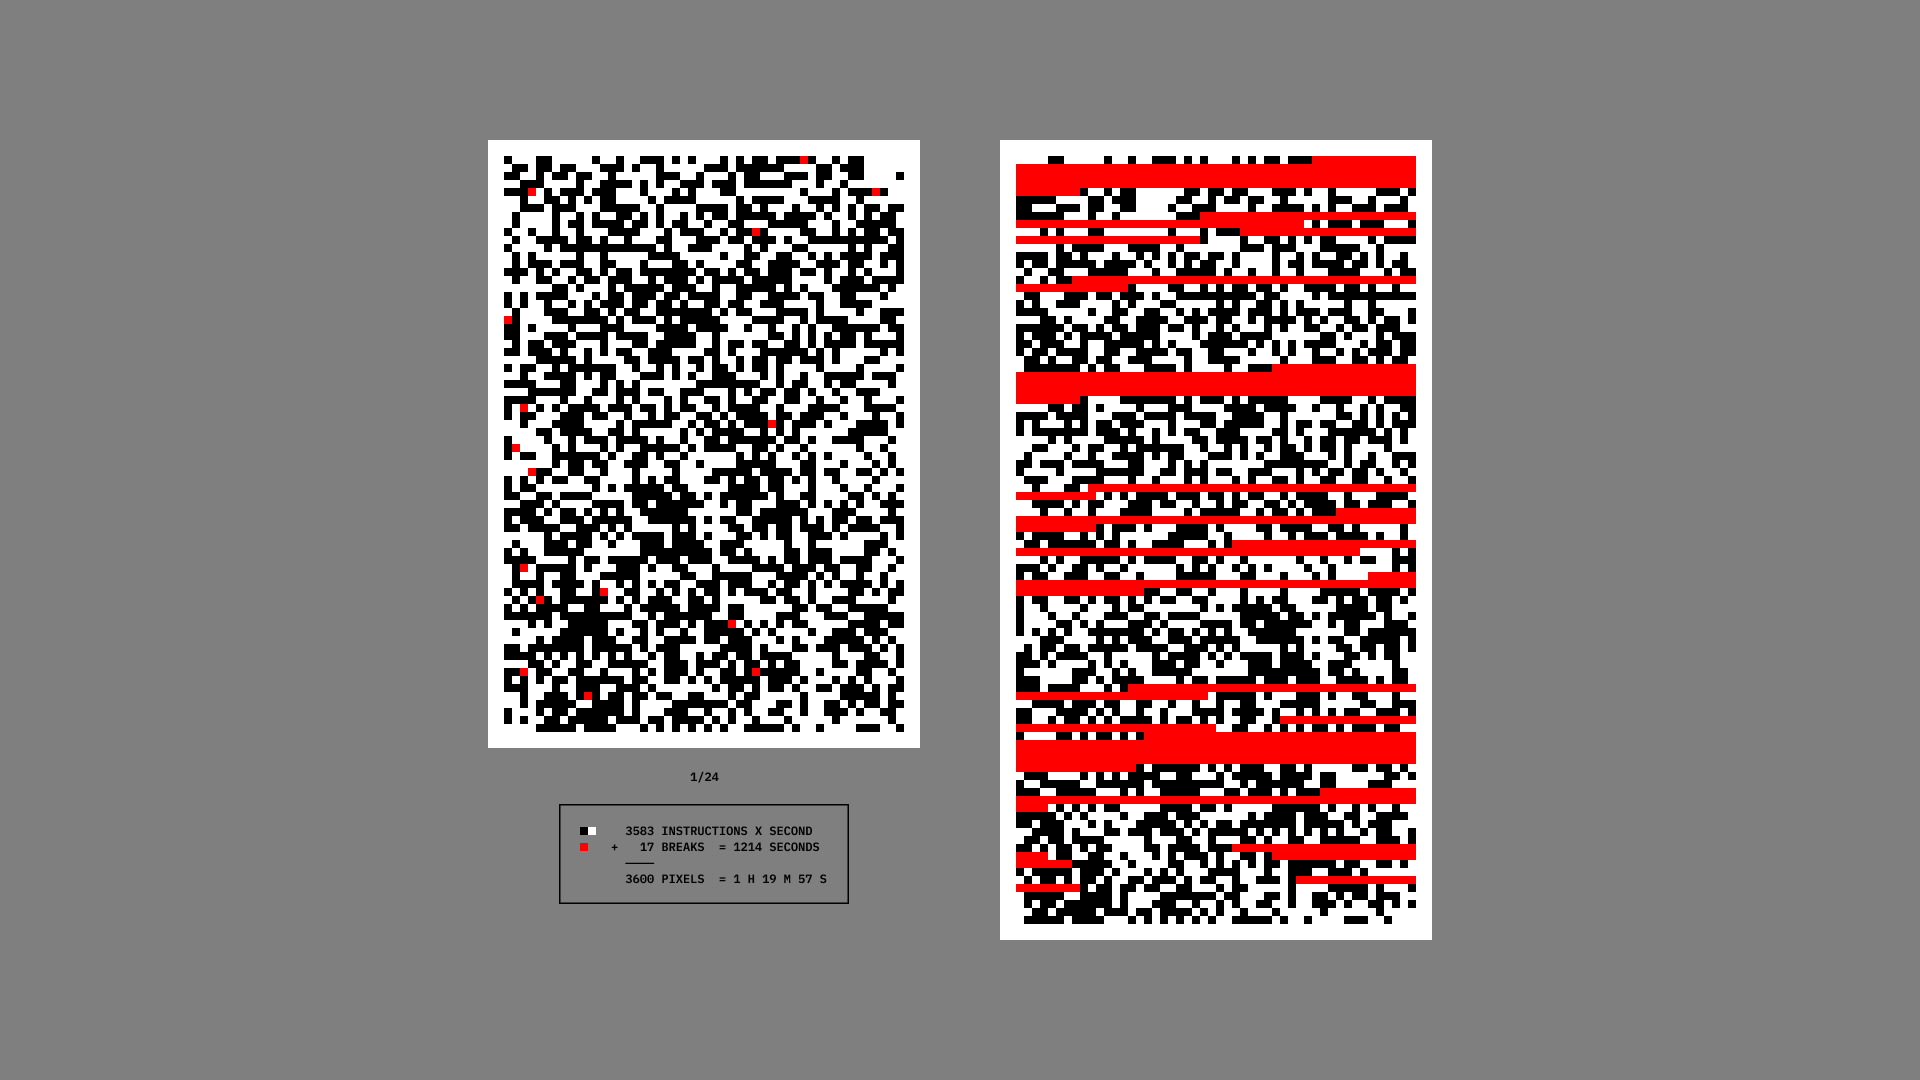
↑ On the left side of the image is the digitized result of the first sheet. On the right side, a visualization of the time required to complete the same sheet.
The red points represent moments when I had to stop due to losing my attention. However, while each point occupies a single square, it does not necessarily correspond to one second. After the performance, I process the data to visualize the actual time required to complete each sheet, expanding the red points to accurately reflect the duration of each break.
The image contrasts the theoretical completion time of one hour per sheet (left) with the actual time required to complete the first sheet (right).
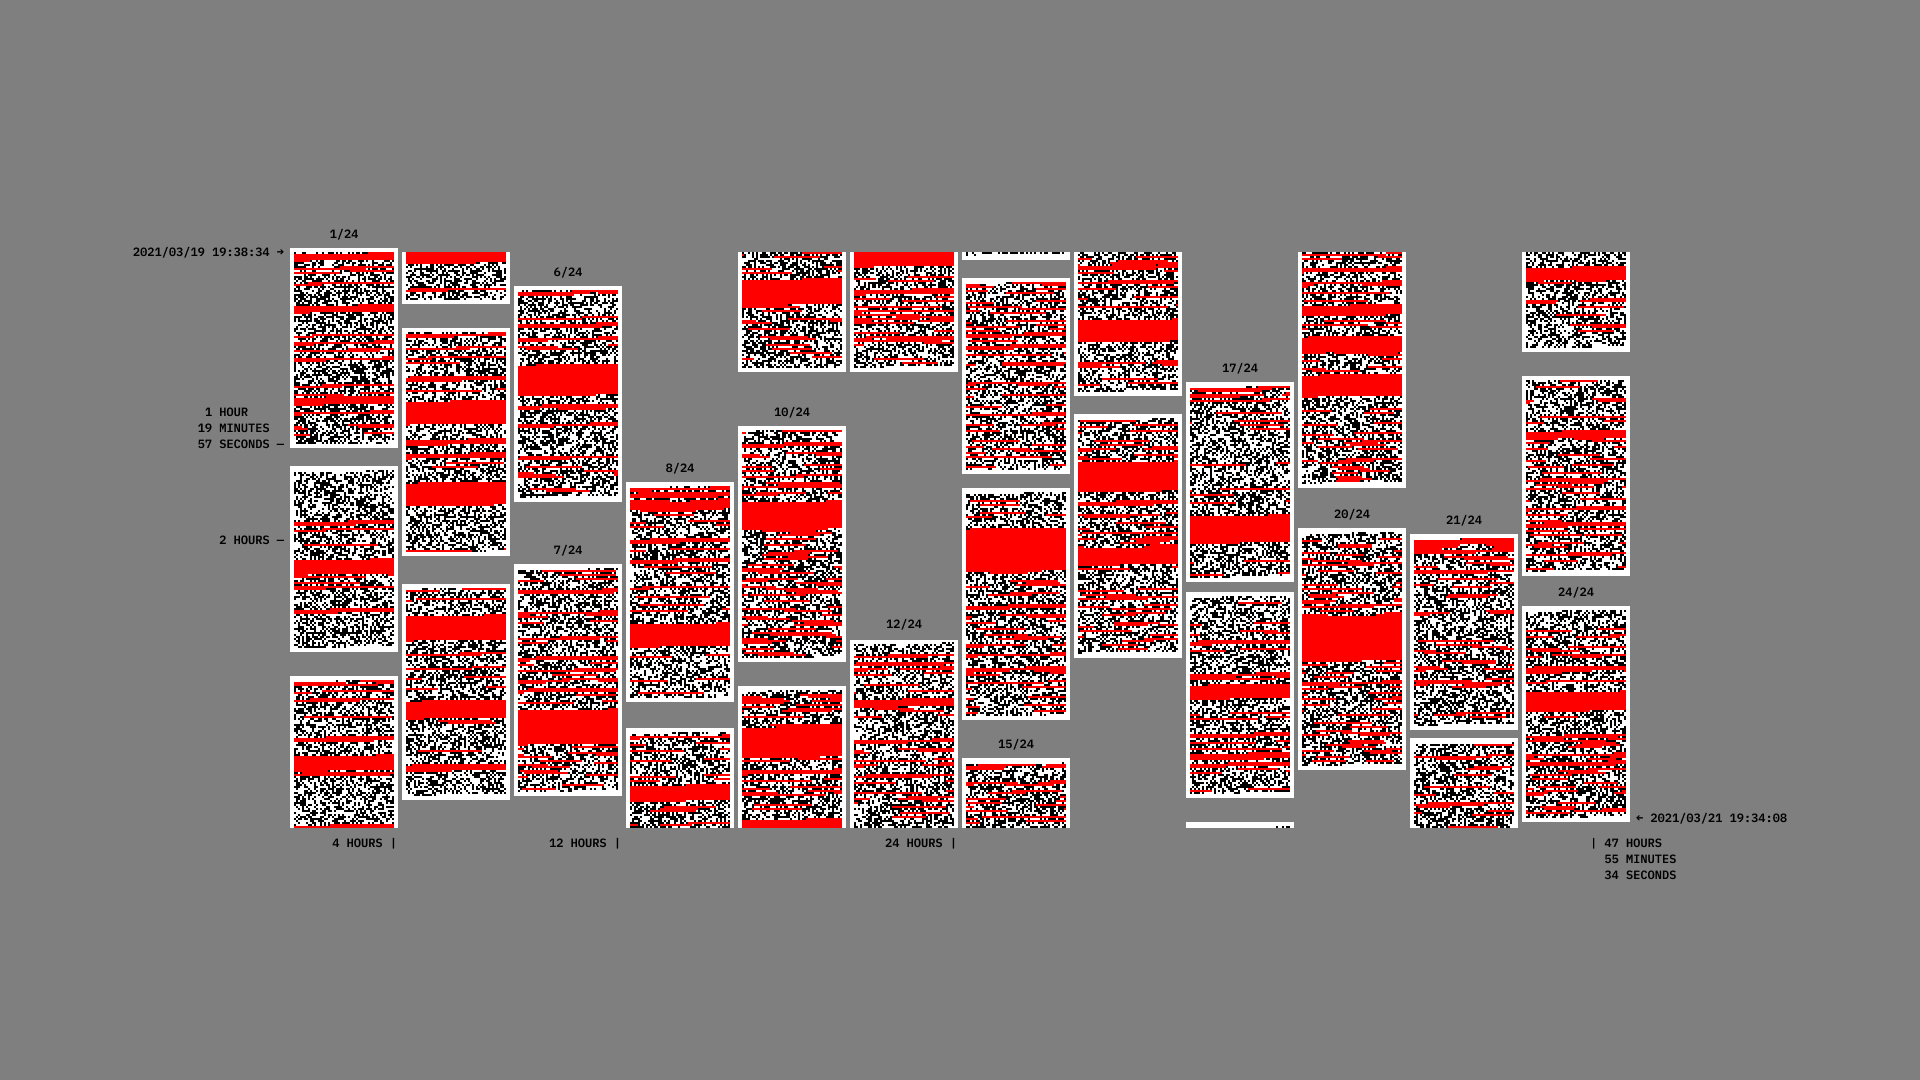
While I knew that the minimum time to complete a sheet was one hour, I could not predict the exact duration of each sheet —let alone the total time needed to complete all 24 sheets.